Aerospike Cluster Manager UI
Aerospike Cluster Manager is a web-based GUI for managing Aerospike CE clusters. It is included in the Operator Helm chart and can be deployed optionally.
Installation
The Cluster Manager UI (api + web Deployments) is enabled by default in chart 0.4.0+. A plain install brings everything up:
helm install acko oci://ghcr.io/aerospike-ce-ecosystem/charts/aerospike-ce-kubernetes-operator \
  --namespace aerospike-operator --create-namespace
To skip the UI entirely, set both component toggles to false:
--set ui.api.enabled=false --set ui.web.enabled=false.
When ui.rbac.create=true (the default), the ClusterRole created by the Helm chart includes full access to horizontalpodautoscalers resources in the autoscaling API group. This permission is required for the UI to create, view, and delete HPAs.
Verify the UI pod:
kubectl -n aerospike-operator get pods -l app.kubernetes.io/component=ui
Access via port-forwarding:
kubectl -n aerospike-operator port-forward svc/acko-aerospike-ce-kubernetes-operator-ui 3000:3000
Open http://localhost:3000 in your browser.
Clusters
Select a cluster from the connection list in the sidebar, or view clusters as cards on the main screen. Each card shows the connection status, node count, namespace count, and Aerospike version.

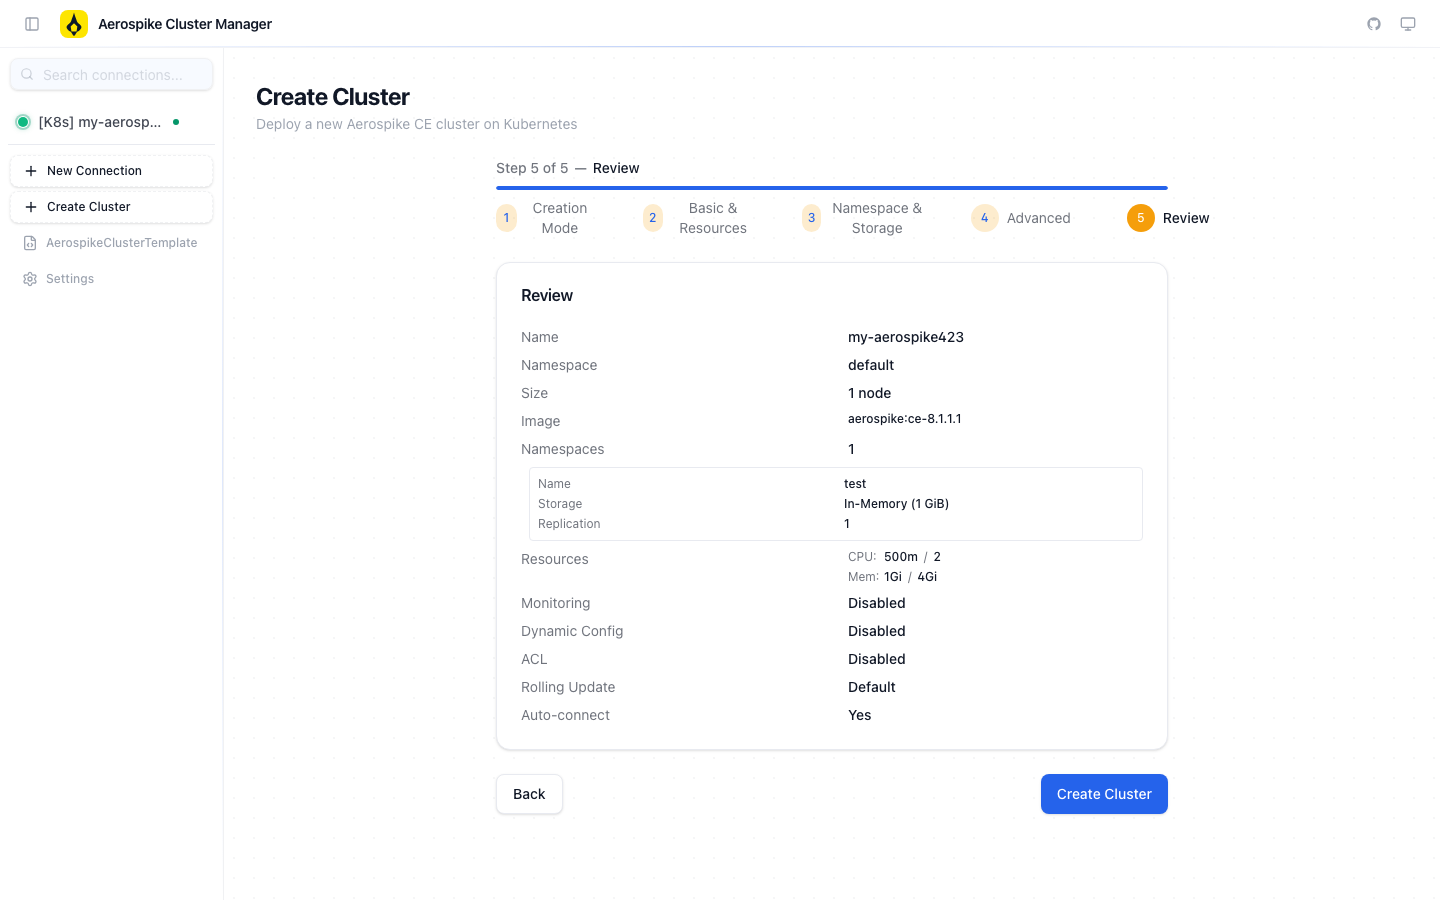
Create Cluster
Start the cluster creation wizard from the sidebar Create Cluster button or the top-right button. The wizard has 9 steps:
Step 1 — Basic: Configure the cluster name, K8s namespace, node count (1–8), and Aerospike image.

Step 3 — Monitoring & Options: Configure the following:
- Prometheus Monitoring — Enable the metrics exporter sidecar and set the port. Additional configuration: exporter image, metric labels, exporter resources (CPU/memory), ServiceMonitor (enabled/interval/labels), PrometheusRule (enabled/labels/customRules). Specifying
customRulesin PrometheusRule fully replaces the default alerts (NodeDown, StopWrites, HighDiskUsage, HighMemoryUsage) with your custom rules. See the Monitoring guide for details. - Dynamic Config — Apply configuration changes without restarting
- Network Access — Client access method (Pod IP, Host Internal/External, Configured IP). When
configuredIPis selected, a custom network names input field appears. - Kubernetes NetworkPolicy — Auto-generate K8s NetworkPolicy (standard or Cilium)
- Seeds Finder LoadBalancer — Create a LoadBalancer service for external seed discovery. The following fields can be configured in the UI:
| Field | Description |
|---|---|
| Port | External LoadBalancer port (default: 3000) |
| Target Port | Container port to forward traffic to (default: 3000) |
| External Traffic Policy | Cluster or Local. Setting Local preserves the client source IP. |
| Annotations | Cloud provider-specific LoadBalancer configuration (e.g., AWS NLB type, internal scheme) |
| Labels | Custom labels to add to the LoadBalancer service |
| Source Ranges | CIDR list of allowed traffic ranges (restrict to specific IP ranges for security) |
This configuration maps to the spec.seedsFinderServices.loadBalancer field. See Networking — SeedsFinderServices for details.
Step 8 — Review: Review all settings and click Create Cluster to deploy.
Cluster List
The K8s Clusters page displays all AerospikeClusters as cards. Each card shows:
- Phase Badge — Cluster state (Completed, InProgress, Error, ScalingUp, etc.)
- Node Count — Current number of nodes in the cluster
- Image — The Aerospike image in use
- Age — Time elapsed since the cluster was created
- Template Drift Badge — Warning indicator when the configuration differs from the referenced AerospikeClusterTemplate
- Failed Reconcile Count Badge — Number of consecutive reconciliation failures (useful for identifying stuck clusters)
Edit Cluster
The Edit dialog uses diff-based patching to apply only the changed fields. Supported edit items:
- Image / Size — Change the image and scale the cluster
- Resources — Set CPU/Memory requests and limits
- ACL (Access Control) — Enable/disable ACL, manage roles (privileges, CIDR Whitelist), manage users (K8s Secret passwords)
- Aerospike Config — Directly edit Aerospike configuration via a JSON editor
- Dynamic Config — Enable configuration changes without restart
- Monitoring — Prometheus exporter, ServiceMonitor, PrometheusRule settings, Metric Labels, Exporter environment variables
- Network — Access Type, Fabric Type, NetworkPolicy auto-generation, Bandwidth limits
- Storage — Multi-volume management (PVC, EmptyDir, Secret, ConfigMap, HostPath)
- Pod Scheduling — NodeSelector, Tolerations, Affinity, Host Network, Service Account, Priority Class Name
- Topology Spread — Pod distribution constraints
- Security Context — runAsUser, fsGroup, supplementalGroups
- Sidecars / Init Containers — Add custom containers
- Service Metadata — Pod Service and Headless Service labels/annotations
- Seeds Finder Services — LoadBalancer seed discovery service
- Rack Topology — Add/remove racks, assign zone/region/nodeName/revision, per-rack config/storage/scheduling overrides
- Aerospike Container Security Context — Container-level security settings for the Aerospike container (runAsUser, runAsGroup, privileged, runAsNonRoot, readOnlyRootFilesystem, allowPrivilegeEscalation)
- Node Block List — Select blocked nodes using the K8s node picker
Client-side validation: The Edit dialog performs the following validations before sending to the Operator webhook:
- Reject images below CE 8, reject Enterprise edition images (CE operator does not support Enterprise images), block
xdr/tlsforbidden keys, prevent simultaneous rack additions and deletions, cross-validate replication factor vs size, CE namespace limit (max 2, consistent with operator webhook validation)
Rack Topology Editing
The Rack Config tab in the Edit dialog allows you to modify the rack topology even after cluster creation. Supported operations:
- Add rack — Add a new rack by specifying a new rack ID along with zone, region, and nodeName.
- Remove rack — Remove an existing rack. Pods in that rack are scaled down sequentially.
- Zone / Region / NodeName assignment — Modify the topology constraints for each rack. You can select existing K8s node zone and region label values from a dropdown or enter them manually.
- Revision — Assign a version identifier to each rack. Changing the revision causes all pods in that rack to restart sequentially. Useful when you want to restart a specific rack without any configuration changes.
- Per-rack overrides — Configure the following items differently from the cluster-level settings on a per-rack basis:
- Aerospike Config — Per-rack namespace memory sizes, storage-engine settings, etc.
- Storage — Per-rack StorageClass, volume size changes (e.g., use io2 in a specific AZ)
- Scheduling — Per-rack nodeSelector, tolerations, affinity overrides
Rack topology changes involve StatefulSet reconfiguration and may cause pod restarts. In production environments, review the scope of impact on the Review step before applying changes.
Node Block List Picker
When configuring the Node Block List in the Pod Scheduling tab of the Edit dialog, the actual node list from the K8s cluster is displayed as checkboxes. You can visually select nodes to block instead of typing them manually.
- Auto-fetch node list — Retrieves the current cluster's nodes from the K8s API and displays them.
- Checkbox selection — Check or uncheck nodes to block.
- Node information display — Each node's name, status (Ready/NotReady), zone, instance type, and other key label information are shown.
- Search filter — Filter by name to quickly find a node when the list is large.
This configuration maps to spec.podSpec.nodeBlockList, and Aerospike Pods will not be scheduled on selected nodes.
Container Security Context
In the Security Context tab of the Edit dialog, you can configure container-level security via the Container Security Context section in addition to Pod-level security context. The following fields are available:
| Field | Description |
|---|---|
| runAsUser | UID to run the container process as |
| runAsGroup | Primary GID of the container process |
| runAsNonRoot | When set to true, prevents the container from running as root (UID 0) |
| privileged | Whether to enable privileged mode |
| readOnlyRootFilesystem | Mount the root filesystem as read-only |
| allowPrivilegeEscalation | Whether to allow child processes to gain elevated privileges |
This configuration maps to spec.podSpec.aerospikeContainer.securityContext.
The official Aerospike CE image runs as root. Setting runAsNonRoot: true may prevent the Pod from starting.
Cluster Overview
Selecting a cluster displays the Overview tab. Get an at-a-glance view of the cluster Phase, Pod Ready count, health conditions (Stable / Config Applied / Available / ACL Synced), and the Pod list.
Use the action buttons at the top to run Scale, Edit, Warm Restart, Pod Restart, Pause, and Delete operations.
Operation In-Progress Guard: The Warm Restart and Pod Restart buttons are automatically disabled when another operation is in progress. This prevents accidental duplicate operations and protects cluster stability.
Split-brain Detection: If the cluster size reported by Aerospike asinfo differs from the expected K8s Pod count, a warning banner is displayed on the cluster detail page. This may indicate a network partition where not all nodes are aware of each other.
If an operation becomes stuck in InProgress state, use the Clear button on the Operation Status card to reset spec.operations and unblock the cluster.

The ACKO INFO tab shows detailed per-node information (Build, Edition, Uptime, Connections, Cluster Size).

Migration Status Display
When partition migrations are in progress due to scaling or configuration changes, you can monitor the migration status in real time on the Overview page.
- Real-time progress — Displays the remaining partition count and a progress bar.
- Per-pod migration breakdown — View the number of partitions each Pod is migrating in the Pod table.
- Auto-refresh — Automatically refreshes every 5 seconds while migration is active.
- Visual indicators — Progress bar and status badges provide an intuitive view of migration state.
- Rack topology integration — Pods currently migrating are highlighted in the rack topology view.
When migration completes, the status display disappears automatically and the cluster transitions to the Stable state.
Disconnected State
When the Aerospike connection is lost, the Overview and Browser pages display a disconnected state screen instead of skeleton loading. A WifiOff icon appears along with a message guiding reconnection.
Split-Brain Detection
The Overview page automatically detects split-brain conditions. When status.aerospikeClusterSize and status.size are mismatched, a warning badge and details are shown:
- Cluster Size Mismatch — Difference between the cluster size reported by Aerospike and the Kubernetes Pod count
- Per-node cluster information — Compare the
cluster_keyandcluster_sizereported by each node to identify isolated partitions - Automatic detection — Continuously monitored on page load and during auto-refresh
Pod Volume Status Indicators
The Pod table provides a visual view of volume status for each Pod:
- Dirty Volumes — If
status.pods[].dirtyVolumeshas values, a warning icon and the names of volumes that need initialization are displayed. - Initialized Volumes — Displays the list of volumes recorded in
status.pods[].initializedVolumesas initialization-complete.
Clone Cluster
Select Clone from the action menu on the cluster detail page to create a new cluster by cloning the configuration of an existing cluster. You change the cluster name and namespace during cloning; the rest of the settings (image, size, Aerospike configuration, storage, monitoring, etc.) are copied from the source cluster.
The cloned cluster does not contain the source cluster's data. Only the configuration is cloned — data is freshly initialized.
Events Timeline
View Kubernetes events on the Events tab of the cluster detail page. Each event shows the type, reason, message, occurrence count, and relative time (e.g., "2m ago"). Auto-refresh is active during transitional phases.
Event Category Filtering
Events in the timeline can be filtered by category. Events are automatically classified into 11 categories:
| Category | Description | Example Events |
|---|---|---|
| Lifecycle | Cluster creation/deletion | ClusterCreated, ClusterDeletionStarted |
| Rolling Restart | Rolling restarts | RollingRestartStarted/Completed, PodRestarted |
| Configuration | Configuration changes | ConfigMapCreated, DynamicConfigApplied |
| ACL Security | Access control | ACLSyncStarted/Completed/Failed |
| Scaling | Scale up/down | RackScaled, PVCCleanupCompleted |
| Rack Management | Rack management | StatefulSetCreated, RackRemoved |
| Network | Network resources | ServiceCreated, PDBCreated, NetworkPolicyCreated |
| Monitoring | Monitoring configuration | MonitoringConfigured |
| Template | Template synchronization | TemplateApplied, TemplateOutOfSync |
| Circuit Breaker | Circuit breaker | CircuitBreakerActive/Reset |
Click a category filter chip to display only that type of event.
Event Export
Click the JSON or CSV download button in the event timeline header to export events. Exports include event type, reason, category, occurrence count, timestamp, and message. If category filters are active, only the filtered events are exported.
Configuration Drift Detection
The Config Status card on the cluster detail page displays the synchronization state of the current configuration:
- In Sync — The desired configuration (spec) matches the applied configuration (appliedSpec)
- Config Drift Detected — A difference has been found between spec and appliedSpec
The list of changed fields and the per-pod configuration hash version are shown. Multiple hash groups indicate that some pods are still running with an older configuration.
The Config Drift API returns actual configuration values through desiredConfig and appliedConfig fields, enabling detailed diff comparison in the UI. Two view modes are supported:
- Fields view (default) — Displays the desired value (
+) and applied value (-) for each changed field with color coding (added,removed,changed). - Side-by-side view — Shows the applied configuration (left, red) and desired configuration (right, green) as a line-by-line JSON diff. Provides line numbers and color highlighting similar to a git diff.
Toggle between views using the Fields / Side-by-side toggle buttons at the top.
When drift is detected, click Force Reconcile to request re-reconciliation from the operator. This adds the acko.io/force-reconcile annotation to the CR to immediately trigger reconciliation.
Reconciliation Health & Circuit Breaker
When reconciliation failures occur, the Reconciliation Health card appears:
- Progress Bar — Progress toward the circuit breaker threshold (10 failures)
- Backoff Timer — Estimated time until the next retry when the circuit breaker is active
- Error Details — Last reconciliation error message
- Reset Button — The dedicated Reset button on the Reconciliation Health card resets the circuit breaker in one click. Previously this required manually patching the CR with
kubectl; now an immediate reset is available via theacko.io/reset-circuit-breakerannotation.
The circuit breaker activates automatically after 10 consecutive failures and retries with exponential backoff (30s × 2^n, max 300s).
PVC / Storage Status
The Storage (PVCs) card on the cluster detail page displays the PersistentVolumeClaim status for the cluster:
- Status Badge — Bound (green), Pending (yellow), Lost (red)
- Capacity — Provisioned storage capacity
- Storage Class — The Kubernetes StorageClass in use
- Access Modes — ReadWriteOnce, ReadWriteMany, etc.
- Volume Name — Name of the bound PersistentVolume
- Pod Binding — Shows which Pod each PVC is mounted on, providing a visual PVC-to-Pod mapping
- Orphan Detection — Automatically detects PVCs not mounted to any running Pod and displays a warning
- PVC deletion — Orphaned PVCs (PVCs not associated with an active Pod) can be deleted directly from the PVC status list. Useful for cleaning up storage resources left over after a scale-down or failed Pod deletion. A confirmation dialog is shown before deletion.
Export / Import
Export — In the Spec section of the cluster detail page, click Copy CR to copy the CR to the clipboard in JSON format.
Import — On the cluster list page, click Import CR to paste existing CR JSON or upload a file to create a cluster. Metadata fields (uid, resourceVersion, managedFields) are automatically removed.
Clone — On the cluster detail page, click Clone to create a new cluster by copying the spec of an existing cluster. Specify a new name and namespace, and the entire spec is cloned excluding operations and paused state. Useful for replicating a production cluster's configuration to a test environment or deploying a validated configuration to another namespace.
When cloning a cluster to a different namespace, the Kubernetes Secrets tied to ACL user passwords (spec.aerospikeAccessControl.users[].secretName) are not automatically copied. For the cloned cluster to start successfully with ACL enabled, the same Secrets must already exist in the target namespace.
Namespaces
The Namespaces tab shows per-namespace object count, storage type, replication factor, memory/disk HWM, and TTL configuration. The Set list for each namespace is also displayed.

Click a Set row to navigate to the record browser. Use Add filter to add Secondary Index-based filters.
Indexes
The Indexes tab shows the Secondary Index list (Name, Namespace, Set, Bin, Type, State) and lets you create new indexes with the + Create Index button.

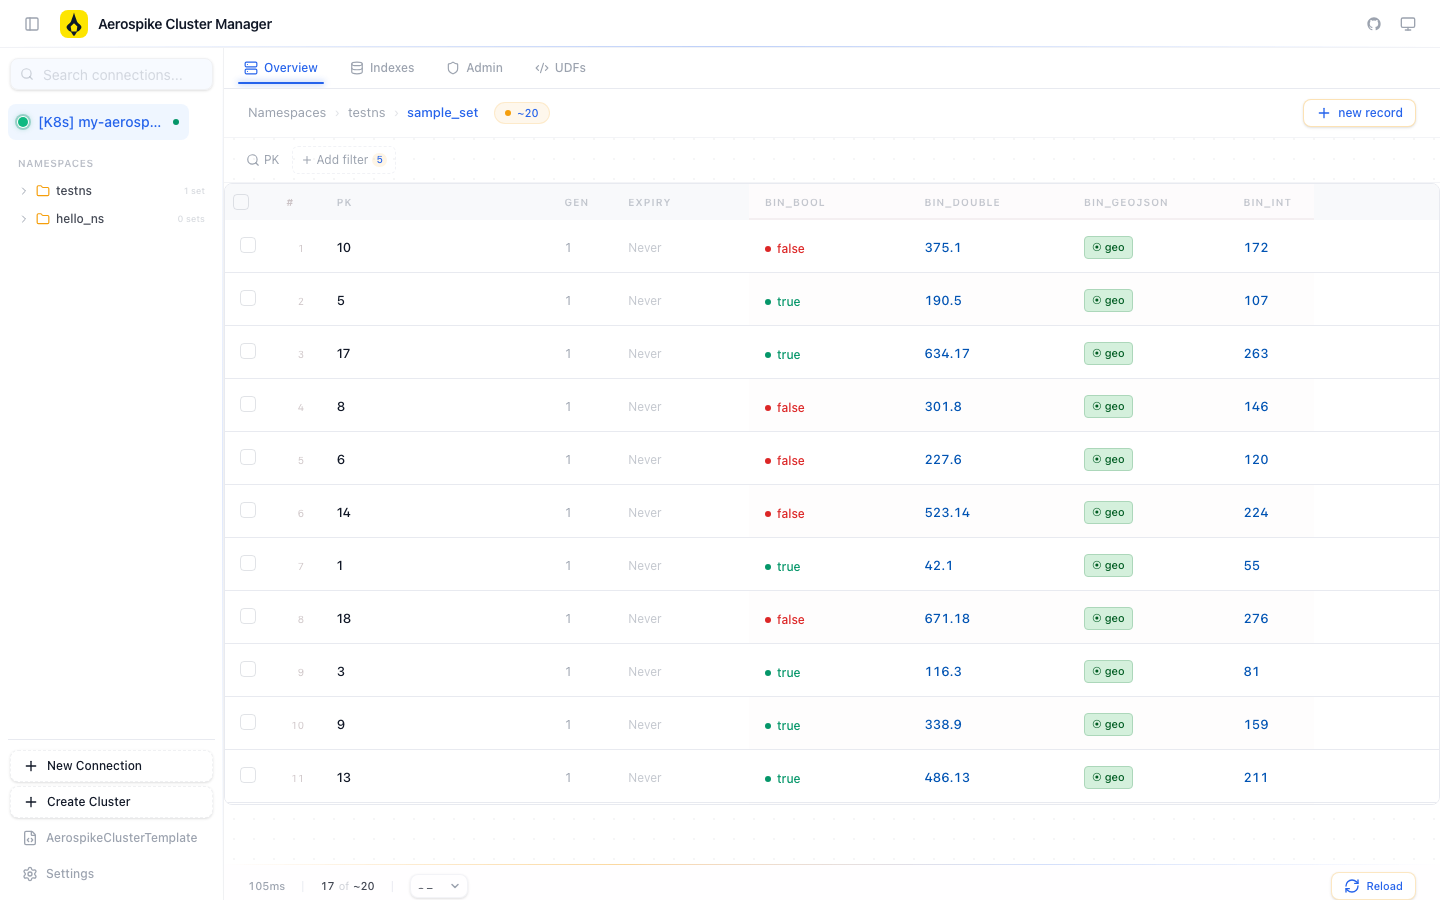
Record Browser
The Browser tab lets you query, create, update, and delete Aerospike records.
- Select a namespace and set to scan records
- Browse large record sets with pagination
- Inline edit bin values for individual records
- Look up records directly by PK (Primary Key)
- Add Secondary Index-based filters for conditional scans
AQL Terminal
The Terminal tab provides an AQL (Aerospike Query Language) terminal built on Monaco Editor.
- Enter and execute AQL commands directly
- Syntax highlighting and auto-completion
- Display query results in table or JSON format
UDF Management
The UDFs tab manages Lua User-Defined Functions.
- View the list of registered UDF modules
- Upload new Lua UDF files
- Delete UDF modules
User & Role Management
The Admin tab manages Aerospike access control (ACL).
- View, create, delete, and change passwords for users
- View, create, and delete roles
- Manage privileges per role
- Map users to roles
Service Metadata
The Advanced step in the cluster creation wizard and the cluster Edit dialog allow you to add custom metadata to Kubernetes services.
Headless Service Metadata
Add custom annotations and labels to the headless service created by the operator (<cluster-name>-headless). Useful for Prometheus service discovery, External DNS integration, or cost tracking.
Per-Pod Service Metadata
When podService is configured, an individual ClusterIP Service is created for each Pod. Add custom annotations and labels for External DNS integration, service mesh connectivity, or Pod-level load balancing.
Pod Metadata
Add custom labels and annotations to the Aerospike Pods themselves. Useful for service mesh sidecar injection (e.g., Istio), monitoring label selectors, and cost allocation tags.
HPA (Horizontal Pod Autoscaler) Management
The cluster detail page lets you manage HorizontalPodAutoscaler (HPA) resources targeting the AerospikeCluster resource. An HPA automatically adjusts the cluster size based on CPU or memory utilization.
Creating an HPA
Select Manage HPA from the action menu on the cluster detail page to create a new HPA. The following items can be configured:
- Min Replicas — Minimum number of Pods to maintain during autoscaling
- Max Replicas — Maximum number of Pods allowed
- CPU Target Utilization — Average CPU utilization (%) that triggers scale-out
- Memory Target Utilization — Average memory utilization (%) that triggers scale-out
The created HPA references the AerospikeCluster as its scaleTargetRef.
Viewing an HPA
When an HPA is associated with a cluster, the current replica count, target metrics, and current metric values are displayed.
Deleting an HPA
If autoscaling is no longer needed, the HPA can be deleted from the UI. After deletion, manual scaling takes over.
HPA management requires the UI ClusterRole to have permissions for the autoscaling API group. This is configured automatically when ui.rbac.create=true (the default).
K8s Cluster Management
When ui.k8s.enabled=true, the K8s Clusters page lets you manage AerospikeCluster CRs through a GUI.
Cluster List
Displays all AerospikeClusters across all namespaces as cards. Each card shows Phase, node count, image, and creation time.
Create Cluster Wizard
Create clusters in Scratch Mode (9 steps) or Template Mode (3 steps):
- Creation Mode — Select Scratch or Template
- Basic — Name, namespace, image, node count
- Namespace & Storage — Aerospike namespace and volume configuration
- Monitoring & Options — Prometheus, Dynamic Config, NetworkPolicy, Seeds Finder LB
- Resources — CPU/Memory requests/limits
- Security & ACL — Role and user configuration
- Rolling Update — Batch size, PDB, Max Unavailable
- Rack Config — Per-rack zone/region settings, rack revision (triggers per-rack rolling restart), per-rack storage overrides (different StorageClass/size), per-rack tolerations/affinity/nodeSelector overrides
- Advanced — Node selector, tolerations, bandwidth, readiness gate, pod metadata (labels/annotations), headless service metadata (annotations/labels), per-pod service metadata (annotations/labels)
- Review — Review all settings and deploy
Cluster Detail
Selecting a cluster provides the following information and actions:
- Overview — Phase, Health, Conditions, Pod list
- Events Timeline — K8s events with filtering by 11 categories, JSON/CSV export support
- Config Drift Detection — spec vs appliedSpec comparison, Fields/Side-by-side diff view, per-pod config hash grouping, Force Reconcile button
- Reconciliation Health — Circuit breaker status, failure count, backoff timer
- PVC / Storage Status — PersistentVolumeClaim status display (Bound/Pending/Lost, capacity, StorageClass)
- Pod Logs — View individual Pod logs
- JSON Export / Import — Export CR as clean JSON (Copy CR), import cluster from JSON file
- Operations — Scale, Edit, Warm Restart, Pod Restart, Pause/Resume, Delete, Manage HPA, Template Resync
Template Management
The K8s Templates page manages the full lifecycle of cluster-scoped AerospikeClusterTemplate resources.
Creating Templates
Click + Create Template to create a new template. Configure the following in the wizard:
- Basic — Template name, default Aerospike image, default cluster size
- Resources — CPU/Memory requests and limits
- Storage — Storage class, volume size, local PV options
- Scheduling — Pod scheduling constraints (see below)
- Monitoring — Prometheus exporter sidecar, ServiceMonitor, PrometheusRule
- Network — Network access policy (accessType, fabricType)
- Aerospike Config — Service settings, namespace defaults
Viewing Templates
On the template list page, the reference cluster count (usedBy count) is displayed on each template card. Click a card to view the full configuration and the list of clusters referencing that template on the detail page.
Editing Templates (Patch/Update)
Click the Edit button on the template detail page to open the Edit dialog. The RBAC configuration grants patch and update permissions on AerospikeClusterTemplate resources to the UI service account, so templates can be edited directly from the UI.
Editable fields:
- Default image and cluster size
- Resource requests/limits
- Storage configuration
- Scheduling configuration
- Monitoring configuration
- Network policy
- Aerospike configuration
Deleting Templates
Only templates with no referencing clusters can be deleted. If clusters are still referencing a template, you must first remove or change their templateRef before deletion.
Template Scheduling Configuration
The scheduling section of a template supports the following scheduling constraints:
| Field | Description |
|---|---|
podAntiAffinityLevel | Pod anti-affinity level: none, preferred, required. When required, only one Aerospike Pod is placed per node. |
tolerations | Array of Kubernetes tolerations. Allows Pods to be scheduled on tainted nodes. |
nodeAffinity | Scheduling constraints based on node labels. Places Pods on specific node pools. |
topologySpreadConstraints | Distributes Pods evenly across topology domains (zone, region, etc.). |
Template Topology Spread Constraints
In the Scheduling step of the template creation/edit wizard, configure topologySpreadConstraints to spread Pods evenly across topology domains. For each constraint, configure the following fields in the UI:
| Field | Description |
|---|---|
| maxSkew | Maximum allowed difference in Pod count between topology domains. A smaller value produces more even distribution. |
| topologyKey | The node label key used as the basis for Pod distribution. Common values: topology.kubernetes.io/zone (by availability zone), kubernetes.io/hostname (by node). |
| whenUnsatisfiable | Behavior when the constraint cannot be satisfied: DoNotSchedule (reject scheduling) or ScheduleAnyway (best-effort scheduling). |
| labelSelector | Label selector to identify Pods subject to distribution. Specify with matchLabels or matchExpressions. |
These settings apply as defaults to all clusters referencing this template. Individual clusters can override using spec.overrides.scheduling.topologySpreadConstraints. See Advanced Configuration — topologySpreadConstraints for details.
Template Resync
After modifying a template, existing clusters that reference it are not automatically updated. Click the Template Resync button on the cluster detail page to re-apply the latest template configuration to the cluster. Internally, this adds the acko.io/resync-template=true annotation to trigger the operator to re-fetch the template.
Configuration Options
| Parameter | Description | Default |
|---|---|---|
ui.api.enabled | Deploy the Cluster Manager API (FastAPI). Combine with ui.web.enabled=false for both-off (operator-only). | true |
ui.web.enabled | Deploy the Cluster Manager web (Next.js). Combine with ui.api.enabled=false for both-off (operator-only). | true |
ui.replicaCount | UI replica count | 1 |
ui.image.repository | UI container image | ghcr.io/aerospike-ce-ecosystem/aerospike-cluster-manager |
ui.image.tag | Image tag | latest |
ui.service.type | Service type | ClusterIP |
ui.service.frontendPort | Frontend (Next.js) port | 3000 |
ui.service.backendPort | Backend (FastAPI) port | 8000 |
ui.service.annotations | Service annotations (cloud LB configuration, etc.) | {} |
ui.ingress.enabled | Create Ingress | false |
ui.persistence.enabled | Use PostgreSQL PVC | true |
ui.persistence.size | PVC storage size | 1Gi |
ui.k8s.enabled | K8s cluster management feature | true |
ui.rbac.create | Auto-create ClusterRole/Binding (includes permissions for AerospikeCluster, Template, and HPA management) | true |
ui.resources.requests.cpu | UI container CPU request | 100m |
ui.resources.requests.memory | UI container memory request | 256Mi |
ui.resources.limits.cpu | UI container CPU limit | 200m |
ui.resources.limits.memory | UI container memory limit | 512Mi |
ui.postgresql.enabled | Deploy embedded PostgreSQL sidecar | true |
ui.env.databaseUrl | External PostgreSQL URL (when postgresql.enabled=false) | "" |
ui.env.corsOrigins | Backend CORS origins (empty string = disable CORS; frontend proxies via Next.js rewrites) | "" |
ui.env.logLevel | Log level (DEBUG, INFO, WARNING, ERROR) | "INFO" |
ui.env.logFormat | Log format: "text" (human-readable), "json" (structured logging) | "text" |
ui.env.dbPoolSize | DB connection pool size | 5 |
ui.env.dbPoolOverflow | Maximum additional connections when pool is full | 10 |
ui.env.dbPoolTimeout | Timeout for acquiring a connection from the pool (seconds) | 30 |
ui.env.k8sApiTimeout | Kubernetes API request timeout (seconds) | 30 |
ui.extraEnv | Additional environment variables for the UI container | [] |
ui.metrics.serviceMonitor.enabled | Create ServiceMonitor for UI backend metrics | false |
ui.metrics.serviceMonitor.interval | Metrics scrape interval | "30s" |
ui.metrics.serviceMonitor.scrapeTimeout | Scrape timeout | "10s" |
ui.metrics.serviceMonitor.labels | Additional ServiceMonitor labels | {} |
View all options:
helm show values oci://ghcr.io/aerospike-ce-ecosystem/charts/aerospike-ce-kubernetes-operator | grep -A 500 "^ui:"
UI Environment Variables
You can tune the UI backend's environment variables via Helm values. These settings are exposed under ui.env.*.
Database Connection Pool
Tune the connection pool for the embedded PostgreSQL sidecar or an external PostgreSQL instance:
| Parameter | Default | Description |
|---|---|---|
ui.env.dbPoolSize | 5 | Base connection pool size. Adjust to match the number of concurrent requests. |
ui.env.dbPoolOverflow | 10 | Maximum additional connections that can be created when the pool is full. Useful for handling traffic spikes. |
ui.env.dbPoolTimeout | 30 | Maximum time (seconds) to wait for an idle connection from the pool. Returns an error if the timeout is exceeded. |
helm install acko oci://ghcr.io/aerospike-ce-ecosystem/charts/aerospike-ce-kubernetes-operator \
  --namespace aerospike-operator --create-namespace \
  --set ui.env.dbPoolSize=10 \
  --set ui.env.dbPoolOverflow=20 \
  --set ui.env.dbPoolTimeout=60
In environments with many concurrent users, increase dbPoolSize. A good rule of thumb is to set dbPoolSize close to the expected number of concurrent requests and dbPoolOverflow to roughly double that.
Kubernetes API Timeout
Configure the timeout for UI requests to the Kubernetes API server:
| Parameter | Default | Description |
|---|---|---|
ui.env.k8sApiTimeout | 30 | K8s API request timeout (seconds). Increase this if list queries are slow on large clusters. |
Logging
| Parameter | Default | Description |
|---|---|---|
ui.env.logLevel | "INFO" | Log level: DEBUG, INFO, WARNING, ERROR |
ui.env.logFormat | "text" | "text": human-readable format, "json": structured JSON format (recommended when integrating with a log collection pipeline) |
# Enable structured JSON logging (recommended when integrating with Loki, Elasticsearch, etc.)
helm install acko oci://ghcr.io/aerospike-ce-ecosystem/charts/aerospike-ce-kubernetes-operator \
  --namespace aerospike-operator --create-namespace \
  --set ui.env.logFormat=json \
  --set ui.env.logLevel=INFO
UI Metrics & ServiceMonitor
The UI backend exposes Prometheus metrics via the /metrics endpoint. In environments using the Prometheus Operator, you can enable a ServiceMonitor to collect metrics automatically.
The ServiceMonitor uses the default Prometheus path /metrics. No separate path configuration is required.
helm install acko oci://ghcr.io/aerospike-ce-ecosystem/charts/aerospike-ce-kubernetes-operator \
  --namespace aerospike-operator --create-namespace \
  --set ui.metrics.serviceMonitor.enabled=true \
  --set ui.metrics.serviceMonitor.labels.release=prometheus
| Parameter | Default | Description |
|---|---|---|
ui.metrics.serviceMonitor.enabled | false | Whether to create the ServiceMonitor resource |
ui.metrics.serviceMonitor.interval | "30s" | Metrics scrape interval |
ui.metrics.serviceMonitor.scrapeTimeout | "10s" | Scrape timeout |
ui.metrics.serviceMonitor.labels | {} | Additional labels for matching the Prometheus selector |
labels.release=prometheus must match the Prometheus Operator's serviceMonitorSelector. Verify with:
kubectl get prometheus -A -o jsonpath='{.items[*].spec.serviceMonitorSelector}'